Historical context: this article was published on 11 June 2025. Its statistics, comparisons and forecasts refer to the period covered by the original report.
In the dynamic and often dizzying world of artificial intelligence, every new analysis from a reputable source is an essential compass for navigating a field that produces dozens of significant developments each week. On 30 May, the influential investment firm BOND, led by renowned analyst Mary Meeker, released its latest comprehensive report, running to almost 350 pages, on the trends defining AI’s present and immediate future. The document offers a highly interesting perspective on the sector’s unprecedented acceleration.
At estrategIA, we have examined the analysis in depth. Below, in seven points, we share its main conclusions and the findings we consider most relevant.
1. An unstoppable pace and a monumental scale
AI is changing the world at an astonishing speed, far exceeding the pace at which the internet transformed our lives. Since ChatGPT burst onto the scene in late 2022, democratising access to powerful language models, we have witnessed exponential growth on every front: data for training these AI models is multiplying, up 260% annually; the computing capacity required is also growing, up 360% annually; and the number of large-scale AI models keeps increasing, up 167% annually. To put this into perspective, ChatGPT reached an annual interaction volume equivalent to 365 billion searches in just two years, a feat that took Google more than ten.
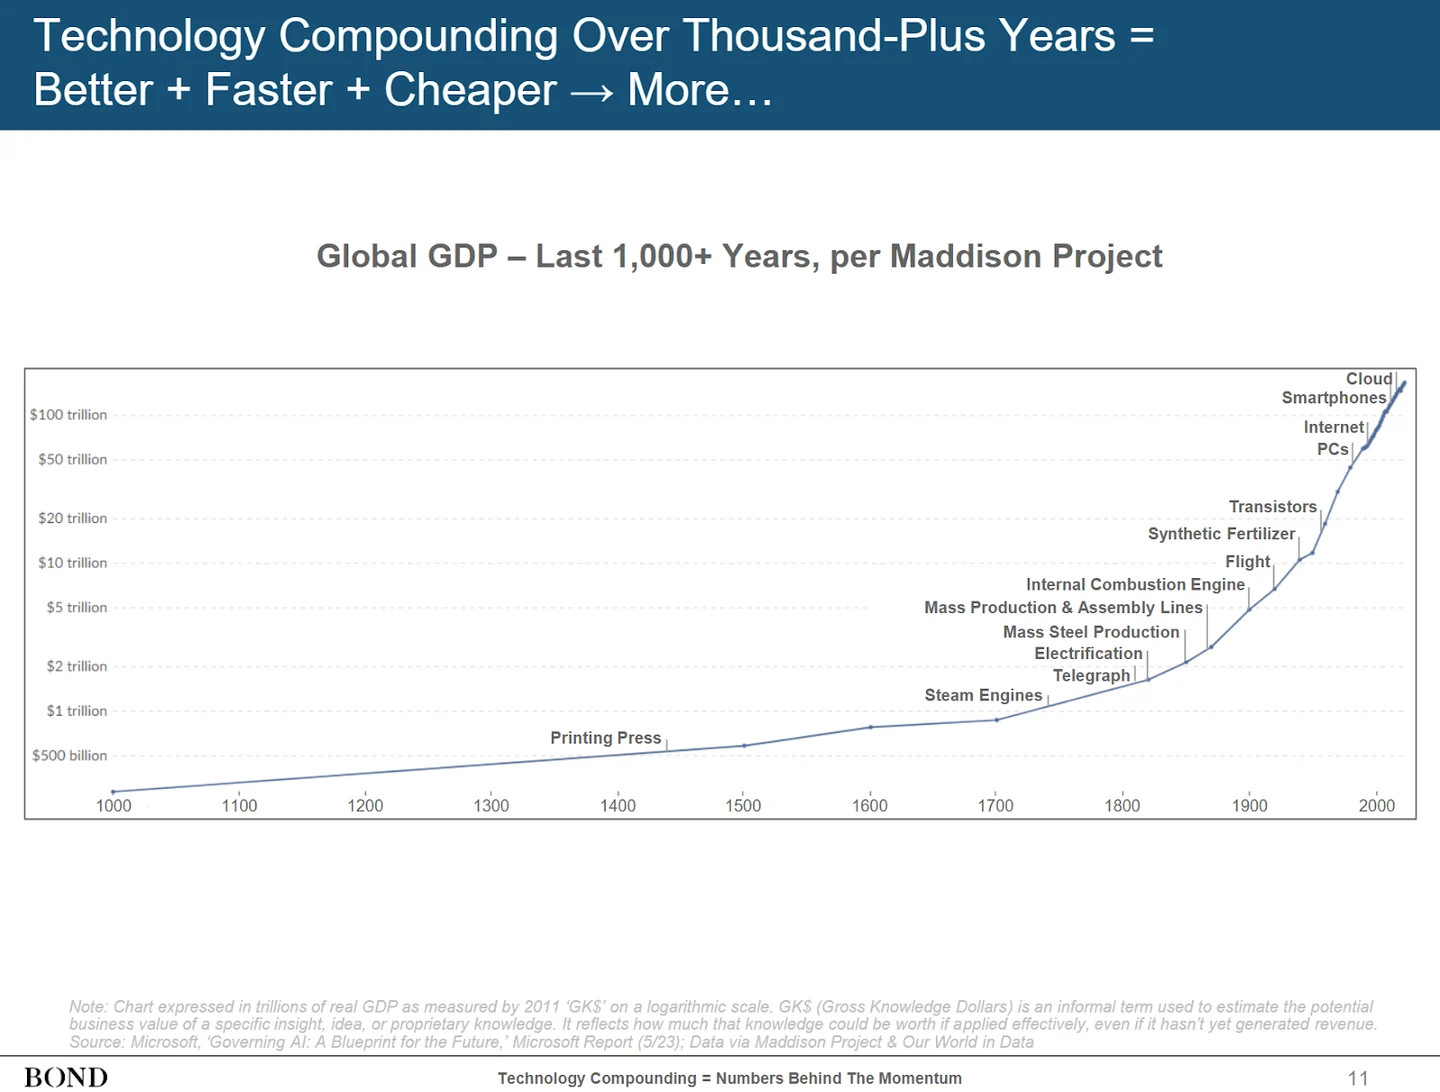
Accessible text of BOND slide 11: “Technology Compounding Over Thousand-Plus Years = Better + Faster + Cheaper → More…”; “Global GDP — Last 1,000+ Years, per Maddison Project”. The horizontal axis labels each century from 1000 to 2000, with the curve continuing beyond 2000. The logarithmic vertical scale is labelled $500 billion, $1 trillion, $2 trillion, $5 trillion, $10 trillion, $20 trillion, $50 trillion and $100 trillion. The line rises slowly at first, then increasingly steeply, exceeding $100 trillion near its end. The annotated milestones, in order, are printing press; steam engines; telegraph; electrification; mass steel production; mass production and assembly lines; internal combustion engine; flight; synthetic fertiliser; transistors; PCs; internet; smartphones; cloud. Exact annual data are not printed.
The slide’s footnote reads: “Chart expressed in trillions of real GDP as measured by 2011 ‘GK$’ on a logarithmic scale. GK$ (Gross Knowledge Dollars) is an informal term used to estimate the potential business value of a specific insight, idea, or proprietary knowledge. It reflects how much that knowledge could be worth if applied effectively, even if it hasn’t yet generated revenue.” This unusual definition is reproduced as printed, not independently validated. Source credit: Microsoft, “Governing AI: A Blueprint for the Future”, Microsoft Report, May 2023; data via Maddison Project and Our World in Data. Footer: “Technology Compounding = Numbers Behind The Momentum”.
2. An explosion in users and capital expenditure
Millions of people and businesses are embracing AI at an unprecedented speed. ChatGPT, the flagship of this wave, now has more than 800 million weekly active users. Globally, AI adoption, especially outside North America, is even faster than internet adoption in its early years. Meanwhile, the major technology companies are investing colossal sums. Capital expenditure, or CapEx, by the US “Big Six” — Apple, NVIDIA, Microsoft, Alphabet, Amazon and Meta — has soared 63% over the past year. They now devote 15% of revenue to it, compared with 8% a decade ago. NVIDIA is emerging as one of the main beneficiaries, capturing a growing share, more than 25%, of worldwide spending on data centres: the new cathedrals of the digital age.
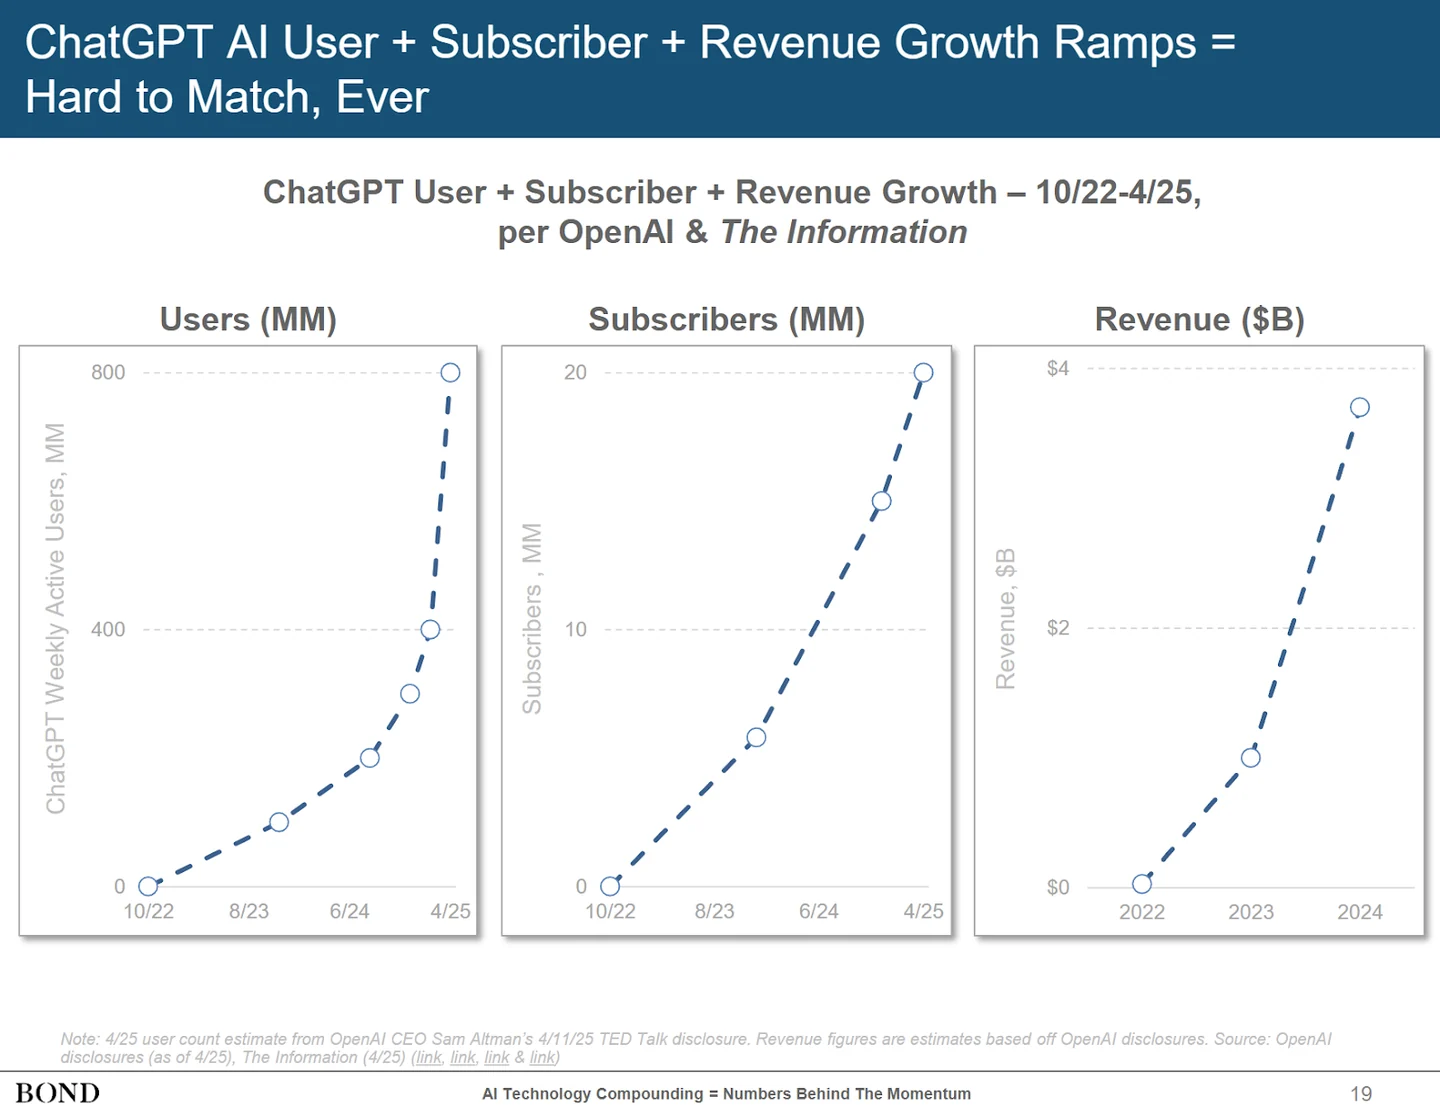
Accessible text of BOND slide 19: “ChatGPT AI User + Subscriber + Revenue Growth Ramps = Hard to Match, Ever”; “ChatGPT User + Subscriber + Revenue Growth — 10/22–4/25, per OpenAI & The Information”. Three charts show:
- Users, millions: weekly active users rise from approximately zero in October 2022 through roughly 100, 200, 300 and 400 million to 800 million in April 2025. The vertical scale labels 0, 400 and 800; intermediate point values and dates are not printed.
- Subscribers, millions: subscribers rise from approximately zero in October 2022 through roughly 6 million and 15 million to 20 million in April 2025. The scale labels 0, 10 and 20; intermediate values are visual estimates.
- Revenue, $ billions: approximately zero in 2022, $1 billion in 2023 and $3.7 billion in 2024, read against ticks at $0, $2 billion and $4 billion. The plotted points do not carry printed values.
The user and subscriber charts label October 2022, August 2023, June 2024 and April 2025 on their horizontal axes. Note: the April 2025 user estimate comes from OpenAI CEO Sam Altman’s 11 April 2025 TED Talk disclosure; revenue figures are estimates based on OpenAI disclosures. Sources: OpenAI disclosures as of April 2025 and The Information, April 2025. The screenshot shows four source labels reading “link”, without visible destination URLs. Footer: “AI Technology Compounding = Numbers Behind The Momentum”.
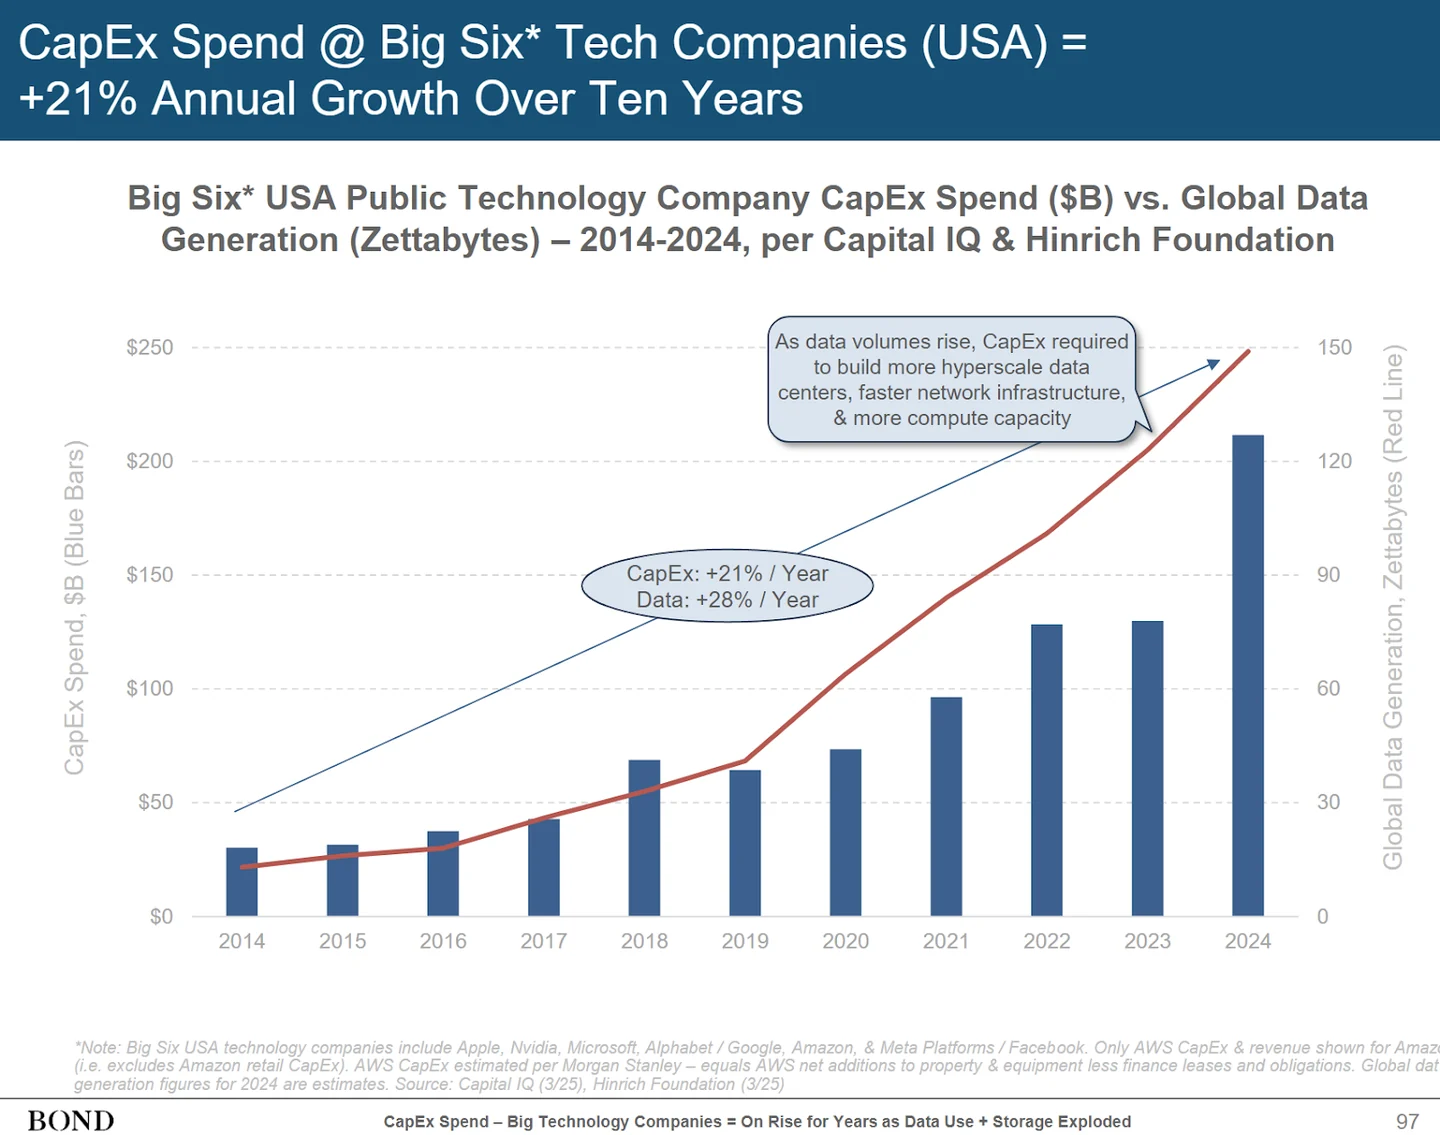
Accessible text of BOND slide 97: “CapEx Spend @ Big Six Tech Companies (USA) = +21% Annual Growth Over Ten Years”; “Big Six USA Public Technology Company CapEx Spend ($B) vs. Global Data Generation (Zettabytes) — 2014–2024, per Capital IQ & Hinrich Foundation”. Blue bars measure CapEx on a left scale from $0 to $250 billion in $50 billion increments; the red line measures global data generation on a right scale from 0 to 150 zettabytes in increments of 30. The horizontal axis covers each year from 2014 to 2024. CapEx grows from about $30 billion to about $210 billion, with a small fall in 2019 and a particularly sharp rise in 2024. Data generation rises from around 13 to around 149 zettabytes. These are approximate visual readings, not printed annual data.
Printed annotations: “CapEx: +21% / Year”; “Data: +28% / Year”; “As data volumes rise, CapEx required to build more hyperscale data centers, faster network infrastructure, & more compute capacity”. The footnote identifies Apple, Nvidia, Microsoft, Alphabet/Google, Amazon and Meta Platforms/Facebook; it specifies that only AWS CapEx and revenue are shown for Amazon, excluding Amazon retail CapEx. AWS CapEx is estimated using Morgan Stanley’s method, AWS net additions to property and equipment less finance leases and obligations. Global data generation figures for 2024 are estimates. A few words at the right edge of the footnote are cropped in the preserved image. Sources: Capital IQ and Hinrich Foundation, March 2025. Footer: “CapEx Spend — Big Technology Companies = On Rise for Years as Data Use + Storage Exploded”.
3. The great dilemma: the cost of creating AI and the challenge of monetising it
Training the most advanced AI models is a colossal undertaking, costing hundreds of millions of dollars per model. Yet once they have been created, the cost of using them, known as “inference”, is plummeting. Thanks to much more efficient chips — such as NVIDIA’s, which consume 105,000 times less energy per generated “word” than a decade ago — and smarter algorithms, inference costs have fallen by an astonishing 99.7% in just two years. This dramatic reduction is excellent news for users and developers, who are seeing AI become more accessible. For the companies investing fortunes in creating these models, however, it raises a crucial question: how do you make a return on a technology that is becoming cheaper to use and faces ever greater competition?
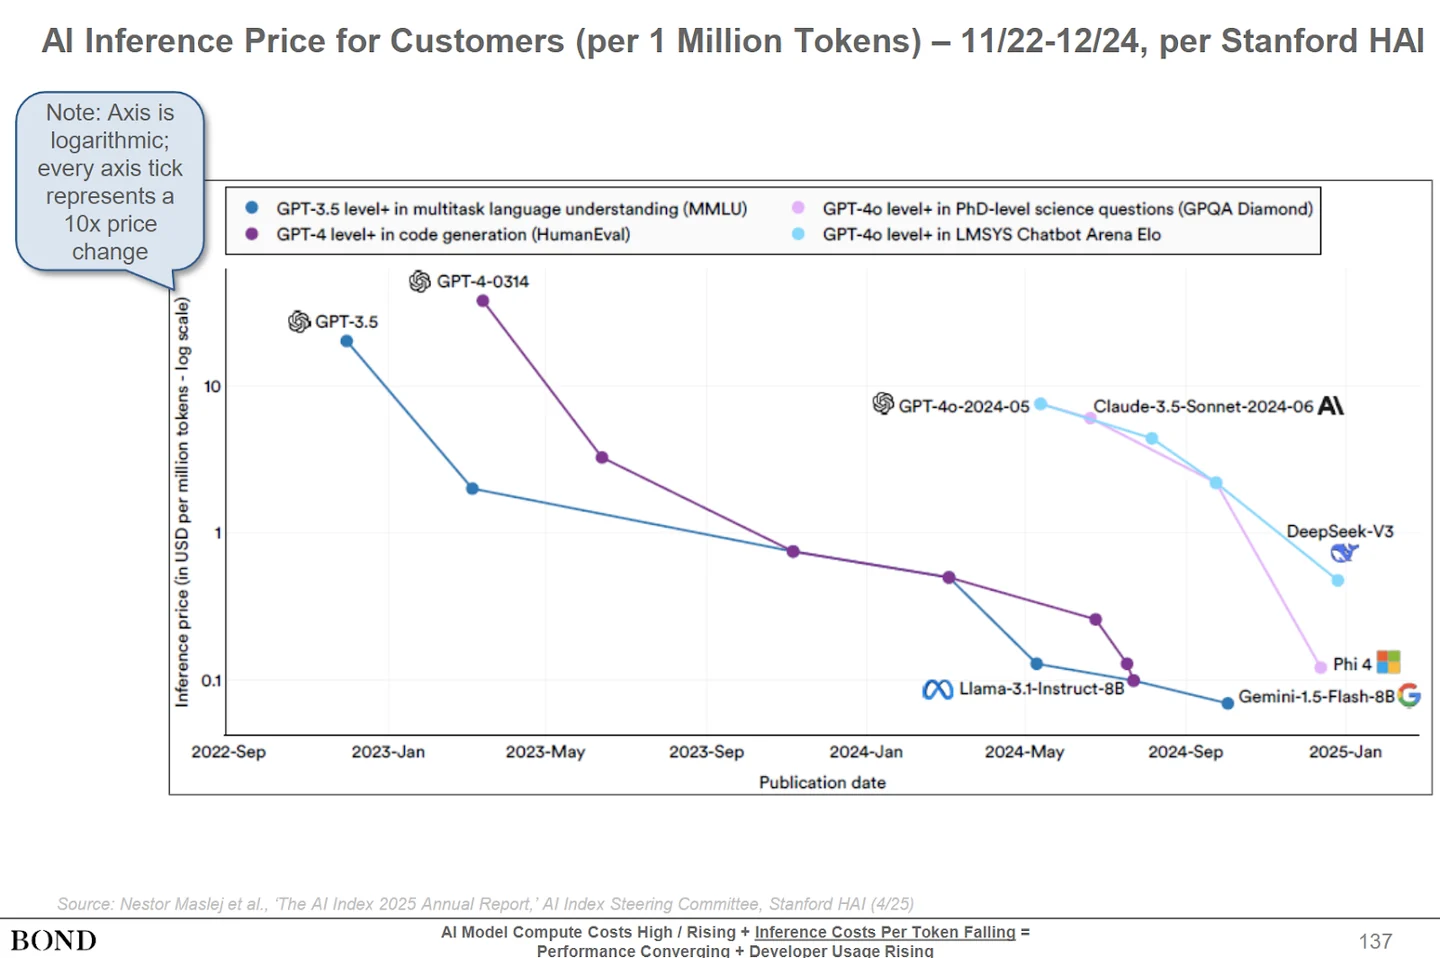
Accessible text of BOND slide 137: “AI Inference Price for Customers (per 1 Million Tokens) — 11/22–12/24, per Stanford HAI”. The vertical axis is inference price in US dollars per million tokens, on a logarithmic scale with labelled ticks at 0.1, 1 and 10. A note explains that each axis tick represents a tenfold price change. The horizontal axis is publication date, labelled September 2022, January 2023, May 2023, September 2023, January 2024, May 2024, September 2024 and January 2025. All four series fall substantially:
- Blue: GPT-3.5 level or above in multitask language understanding, MMLU, from GPT-3.5 near $20 to Gemini-1.5-Flash-8B below $0.10.
- Purple: GPT-4 level or above in code generation, HumanEval, from GPT-4-0314 at several tens of dollars to Llama-3.1-Instruct-8B near $0.10.
- Pale purple: GPT-4o level or above in PhD-level science questions, GPQA Diamond, from Claude-3.5-Sonnet-2024-06 at several dollars to Phi 4 just above $0.10.
- Light blue: GPT-4o level or above in LMSYS Chatbot Arena Elo, from GPT-4o-2024-05 at several dollars to DeepSeek-V3 below $1.
Price descriptions are approximate readings; the points have no numerical labels. Source: Nestor Maslej et al., “The AI Index 2025 Annual Report”, AI Index Steering Committee, Stanford HAI, April 2025. Footer: “AI Model Compute Costs High / Rising + Inference Costs Per Token Falling = Performance Converging + Developer Usage Rising”.
4. Fierce competition and the momentum of open source
Fortunately for us as users, the AI race is not the private preserve of a few giants. New models from multiple players are continually emerging, creating a vibrant, highly competitive ecosystem. A crucial factor is the rise of open-source models, whose designs are public and which anyone can use and modify. Although “closed” or proprietary models, such as those powering ChatGPT or Gemini, remain the most popular among consumers, open-source alternatives are gaining ground rapidly, especially among developers and in countries seeking to build their own AI capabilities without depending on others. Platforms such as Hugging Face have become universal libraries facilitating this trend.
This chart, for example, shows the enormous download success of Meta’s Llama models, although their most recent versions fall short of today’s best open-source models, especially the Chinese ones, in performance.
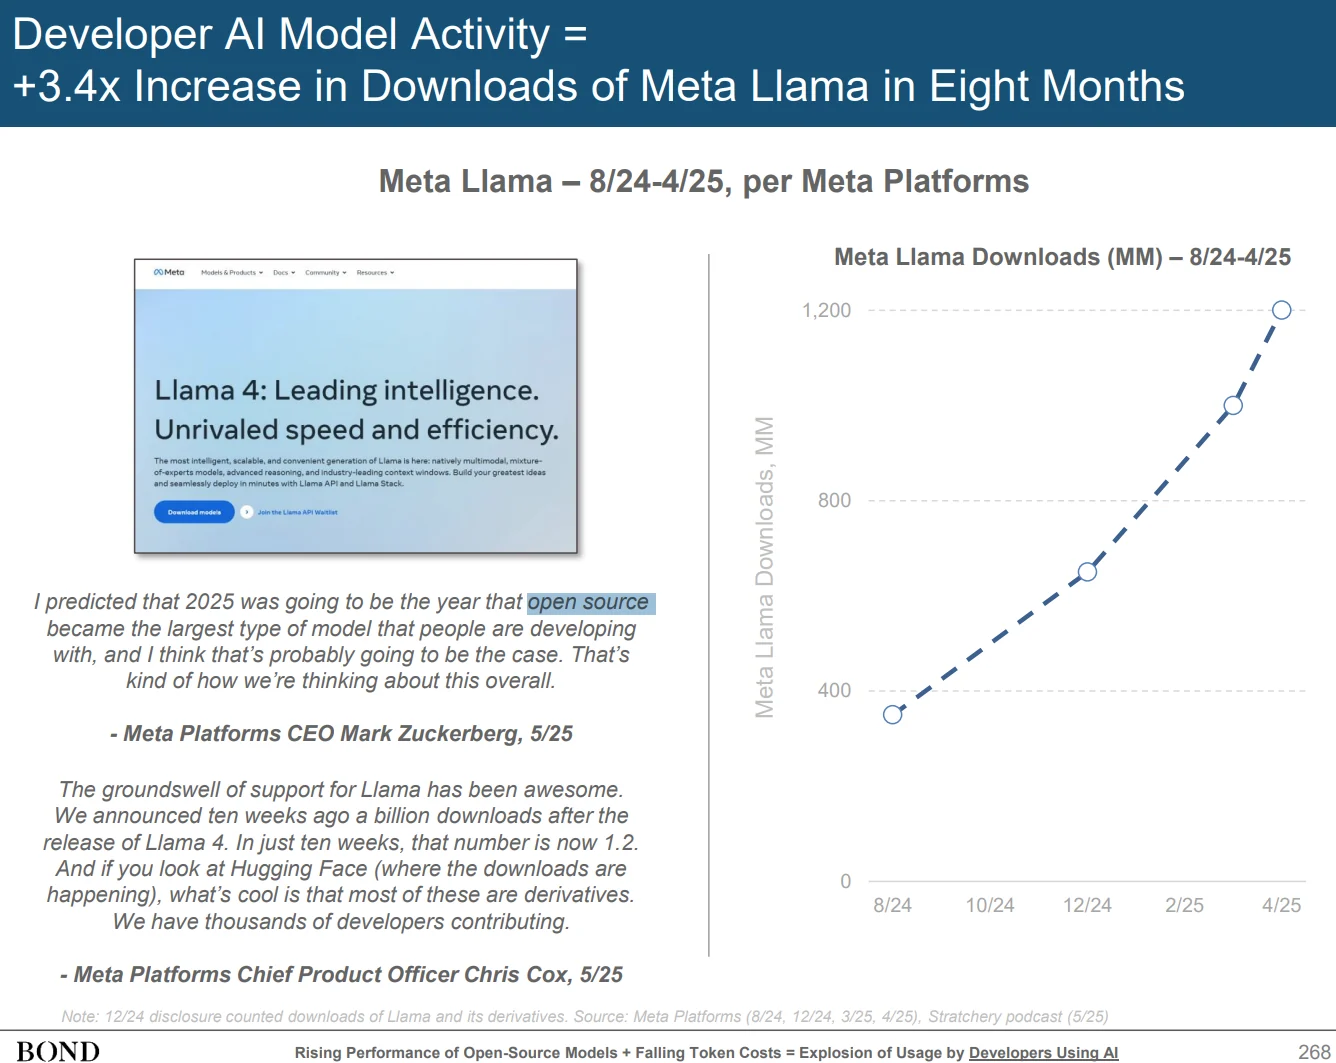
Accessible text of BOND slide 268: “Developer AI Model Activity = +3.4x Increase in Downloads of Meta Llama in Eight Months”; “Meta Llama — 8/24–4/25, per Meta Platforms”. The chart is titled “Meta Llama Downloads (MM) — 8/24–4/25”, with a vertical scale of 0, 400, 800 and 1,200 million and dates August 2024, October 2024, December 2024, February 2025 and April 2025. Points indicate approximately 350 million downloads in August 2024, 650 million in December, one billion in March 2025 and 1.2 billion in April; only the axis values are printed.
The inset Meta webpage reads: “Llama 4: Leading intelligence. Unrivaled speed and efficiency.” “The most intelligent, scalable, and convenient generation of Llama is here: natively multimodal, mixture-of-experts models, advanced reasoning, and industry-leading context windows. Build your greatest ideas and seamlessly deploy in minutes with Llama API and Llama Stack.” Buttons: “Download models”; “Join the Llama API Waitlist”. Navigation: “Models & Products”, “Docs”, “Community”, “Resources”. The following English quotations are transcribed from the screenshot:
I predicted that 2025 was going to be the year that open source became the largest type of model that people are developing with, and I think that’s probably going to be the case. That’s kind of how we’re thinking about this overall.
— Meta Platforms CEO Mark Zuckerberg, May 2025
The groundswell of support for Llama has been awesome. We announced ten weeks ago a billion downloads after the release of Llama 4. In just ten weeks, that number is now 1.2. And if you look at Hugging Face (where the downloads are happening), what’s cool is that most of these are derivatives. We have thousands of developers contributing.
— Meta Platforms Chief Product Officer Chris Cox, May 2025
Note in the slide: the December 2024 disclosure counted downloads of Llama and its derivatives. Sources: Meta Platforms, August 2024, December 2024, March 2025 and April 2025; Stratechery podcast, May 2025. The quotation’s chronology is retained as printed. Footer: “Rising Performance of Open-Source Models + Falling Token Costs = Explosion of Usage by Developers Using AI”.
5. China’s unstoppable rise in AI
BOND’s report does not hesitate to describe the current situation as a new “space race”, with China emerging as a formidable competitor to the United States. The Asian giant is advancing in leaps and bounds, particularly in open-source AI models such as DeepSeek and Qwen, which we have discussed and recommended in earlier issues. It often achieves performance comparable to US models but with lower training costs, increasingly using semiconductors of its own design. Indeed, alongside the United States, China leads the ranking for the creation of large-scale AI systems, leaving the rest of the world behind. Moreover, the country already has an installed base of industrial robots larger than the rest of the world combined, and its citizens are notably more optimistic about AI’s benefits than Americans. This technological competition will undoubtedly have profound geopolitical implications.
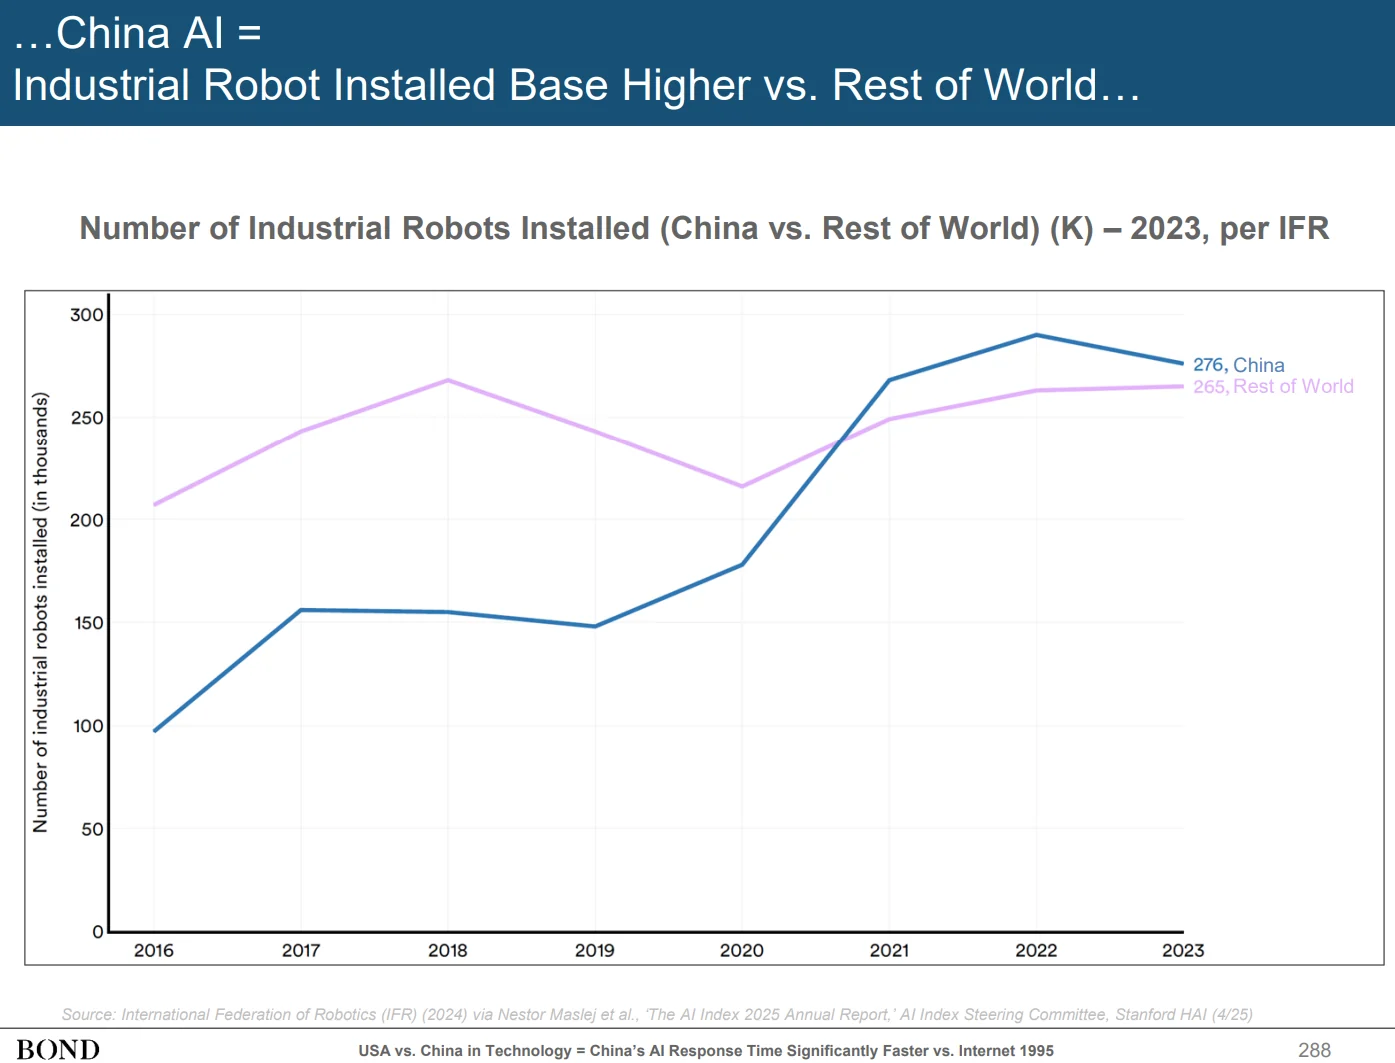
Accessible text of BOND slide 288: “…China AI = Industrial Robot Installed Base Higher vs. Rest of World…”; chart title: “Number of Industrial Robots Installed (China vs. Rest of World) (K) — 2023, per IFR”. The horizontal axis covers 2016–2023; the vertical axis shows thousands of industrial robots installed, from 0 to 300 in steps of 50. China’s blue line rises from just under 100,000 in 2016 to about 155,000 in 2017–2018, dips slightly in 2019, then rises sharply through 2020–2022 before falling to the explicitly labelled 276,000 in 2023. The rest-of-world purple line rises from just over 200,000 in 2016 to roughly 270,000 in 2018, falls to around 215,000 in 2020, then rises to the explicitly labelled 265,000 in 2023. China overtakes the other series in 2021. Apart from the final values, these are approximate visual readings.
Editorial note: the article and slide headline say “installed base”, while the plotted measure is robots installed by year. This distinction in the preserved source has not been silently resolved. Source credit: International Federation of Robotics, 2024, via Nestor Maslej et al., “The AI Index 2025 Annual Report”, Stanford HAI, April 2025. Footer: “USA vs. China in Technology = China’s AI Response Time Significantly Faster vs. Internet 1995”.
6. AI is reimagining work and will conquer the physical world
AI’s influence extends beyond the digital sphere. It is increasingly being integrated into the tangible world: autonomous vehicles such as Tesla’s and Waymo’s, defence systems, precision agriculture with weed-removing robots, and even mineral exploration. This penetration is fundamentally changing how we work. Productivity is expected to rise — a Stanford HAI study already showed a 14% increase in customer-support tasks — and, although the future of employment remains debated, job postings requiring AI skills have increased more than fivefold, up 448%, over the past seven years, while other traditional technology jobs have already seen a slight contraction. Companies such as Shopify already consider proficiency with AI a basic employee skill.
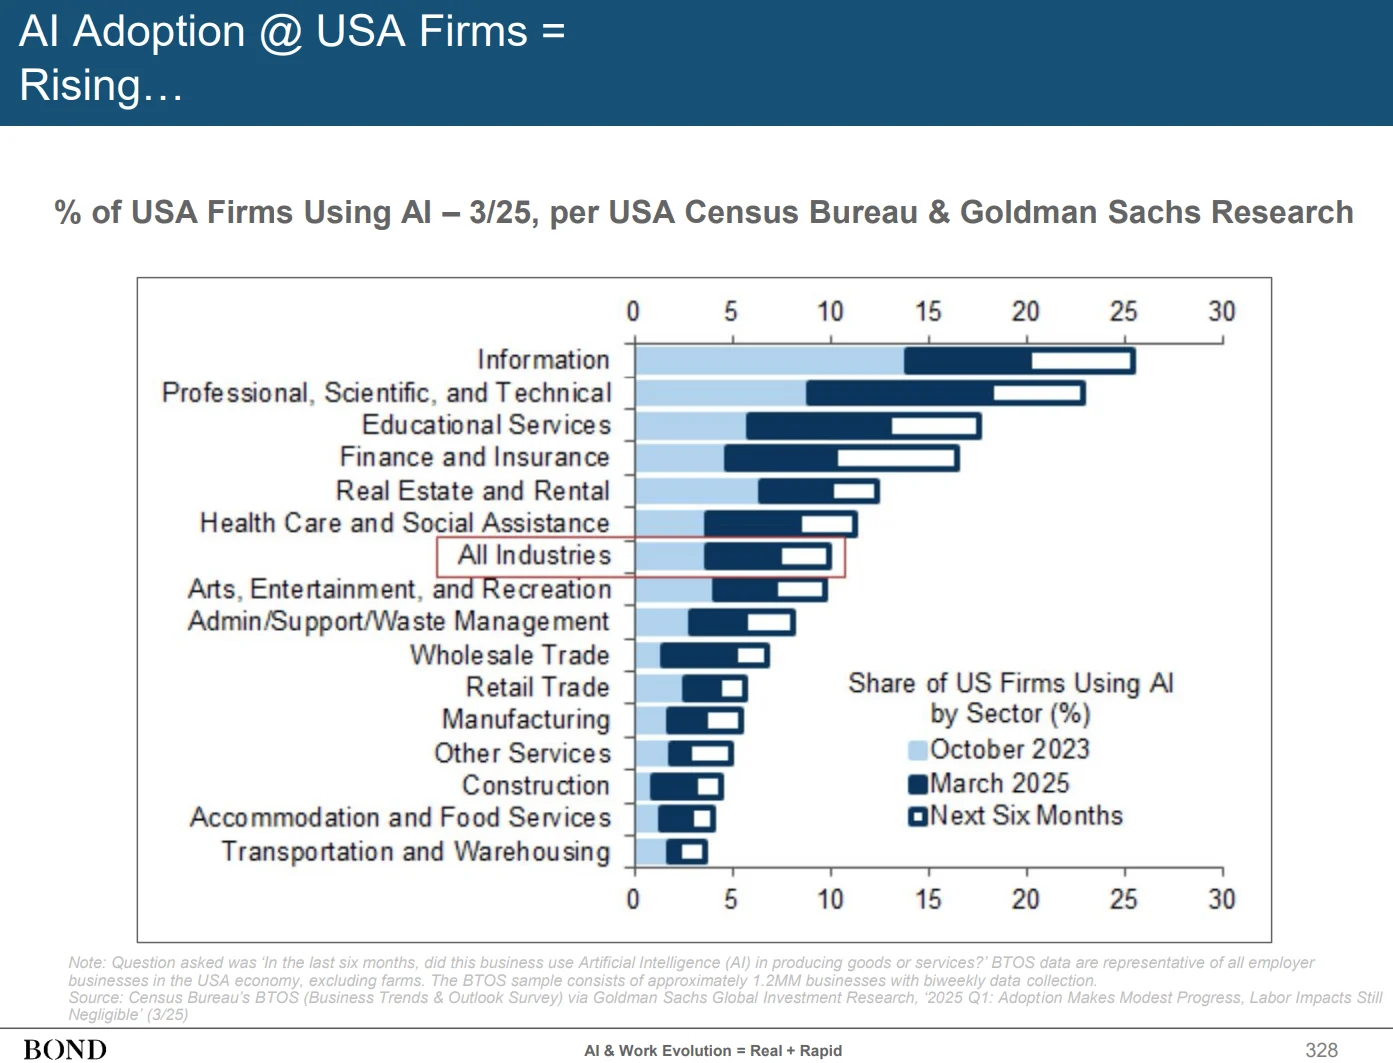
Accessible text of BOND slide 328: “AI Adoption @ USA Firms = Rising…”; “% of USA Firms Using AI — 3/25, per USA Census Bureau & Goldman Sachs Research”. The chart measures the share of US firms using AI by sector, on a 0–30% scale marked every five percentage points. Light blue represents October 2023, dark blue March 2025, and outlined bars the next six months. No bar has a printed numerical value. The table therefore gives approximate visual readings rounded to whole percentage points, not exact survey data.
Scroll across the table to read all columns.
| Sector | October 2023, approximately | March 2025, approximately | Next six months, approximately |
|---|---|---|---|
| Information | 14% | 20% | 25% |
| Professional, scientific and technical | 9% | 18% | 23% |
| Educational services | 6% | 13% | 18% |
| Finance and insurance | 5% | 10% | 16% |
| Real estate and rental | 6% | 10% | 12% |
| Healthcare and social assistance | 4% | 9% | 11% |
| All industries | 4% | 8% | 10% |
| Arts, entertainment and recreation | 4% | 7% | 10% |
| Administration, support and waste management | 3% | 6% | 8% |
| Wholesale trade | 1% | 5% | 7% |
| Retail trade | 2% | 4% | 6% |
| Manufacturing | 2% | 4% | 6% |
| Other services | 2% | 3% | 5% |
| Construction | 1% | 3% | 4% |
| Accommodation and food services | 1% | 3% | 4% |
| Transportation and warehousing | 2% | 2% | 4% |
Survey question: “In the last six months, did this business use Artificial Intelligence (AI) in producing goods or services?” The note says BTOS data represent all employer businesses in the US economy except farms; the sample comprises approximately 1.2 million businesses, with data collected every two weeks. Source: Census Bureau BTOS, Business Trends & Outlook Survey, via Goldman Sachs Global Investment Research, “2025 Q1: Adoption Makes Modest Progress, Labor Impacts Still Negligible”, March 2025. Footer: “AI & Work Evolution = Real + Rapid”.
7. The next frontiers: autonomous agents, artificial general intelligence and connecting the unconnected
Looking ahead, the report sees several promising frontiers. One is the evolution towards “AI agents”: systems that will not merely answer our questions but perform complex tasks autonomously, acting as truly proactive assistants. Further ahead, artificial general intelligence, AGI — machines with cognitive capabilities comparable to humans’ — is increasingly seen less as a distant utopia and more as an attainable horizon. Finally, one of the most transformative prospects is AI’s potential, combined with low-cost satellite connectivity such as SpaceX’s Starlink, to connect the 2.6 billion people currently living without internet access. Their first experience online could be through conversational AI interfaces in their own language: a revolution in itself.
BOND’s report is a wake-up call about the speed and magnitude of AI disruption. Although optimistic about its potential, it does not shy away from economic and geopolitical uncertainties. AI is here, its development is exponential and its implications are profound. Businesses, investors and governments face a landscape of immense opportunities and non-trivial risks. Monetisation remains a complex puzzle for many, competition is fierce, and the struggle between the United States and China for AI leadership has only just begun. As the report concludes, “the genie is out of the bottle”, and the world is entering, at an unprecedented speed, a new era defined by machine intelligence.
Translation note: the closing quotation attributed to the report is translated from the Spanish wording in the article; no primary English wording was checked.
Director of Digital Innovation, ALEPH Educational Institution
Cite this essay
Fernando Nieto Lobato. “BOND’s 2025 report: a portrait of an irreversible transformation.” estrategIA, issue 089, 11 June 2025. English edition, 29 September 2026. https://elcontemplador.github.io/estrategia-english/essays/089/