Over the past two years, we have written a great deal in estrategIA about the technological promise of artificial intelligence. We have analysed models, regulations and fears. Yet we have often lacked a reasonably precise answer to one crucial question: how much is it actually being used? Not what companies say they do, or what opinion polls report, but what is really happening on millions of people's screens.
Last week, the Microsoft AI Economy Institute published its report, Global AI Adoption in 2025—A Widening Digital Divide. In many respects, its findings are good news for those of us who believe in AI's transformative potential for public management and corporate strategy.
Why does this source matter? Unlike studies based on self-reported surveys, in which respondents may exaggerate their knowledge, Microsoft used anonymised, aggregated telemetry. It measured “diffusion” by observing the proportion of the working-age population, aged 15–64, actively using generative AI tools for more than 90 minutes a month. It cleaned the data to address operating-system biases and scaled the results to include mobile use.
We are probably looking at the most accurate behavioural map available to date. It tells us that global adoption has reached 16.3%. That may sound modest, but in the diffusion of technology, passing 15% means that AI crossed the chasm in 2025: it moved beyond a curiosity for early adopters into the early-majority phase. It did so, however, with enormous disparities between countries.
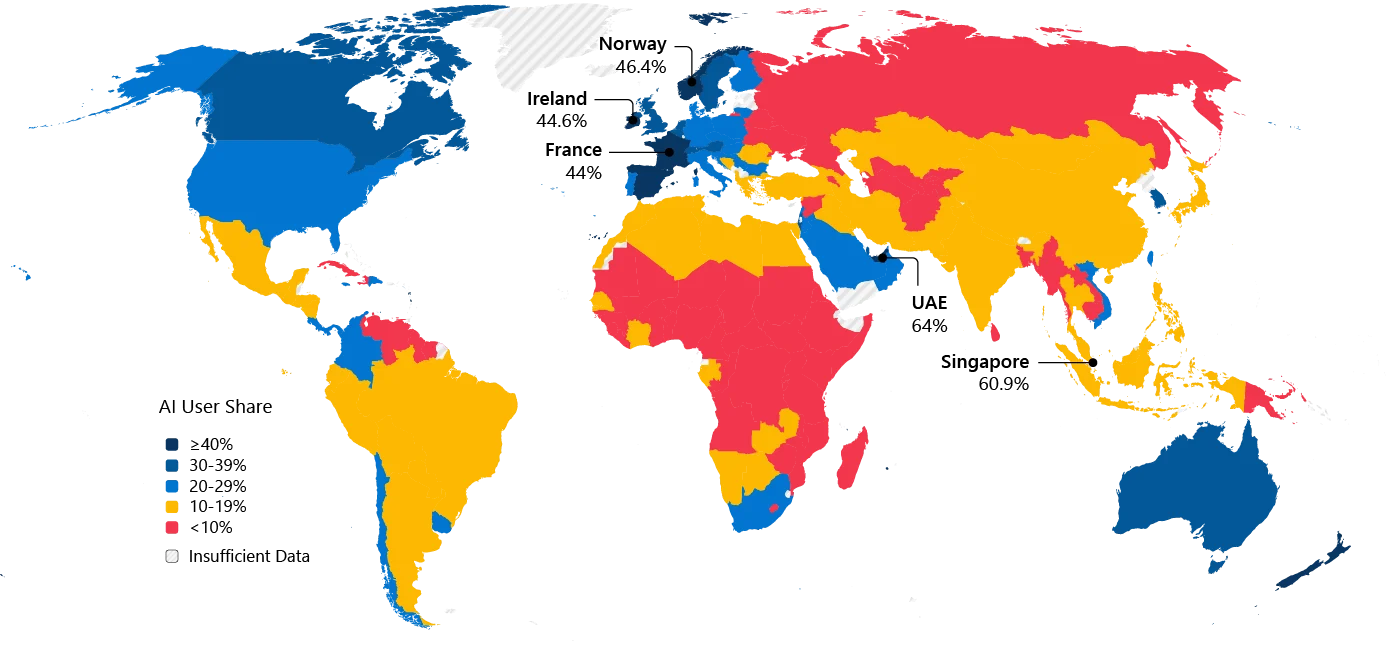
Original world map of AI diffusion. Its AI-user-share bands are over 40%, 30–39%, 20–29%, 10–19% and below 10%; hatching indicates insufficient data. Highlighted countries are the UAE, 64%; Singapore, 60.9%; Norway, 46.4%; Ireland, 44.6%; and France, 44%.
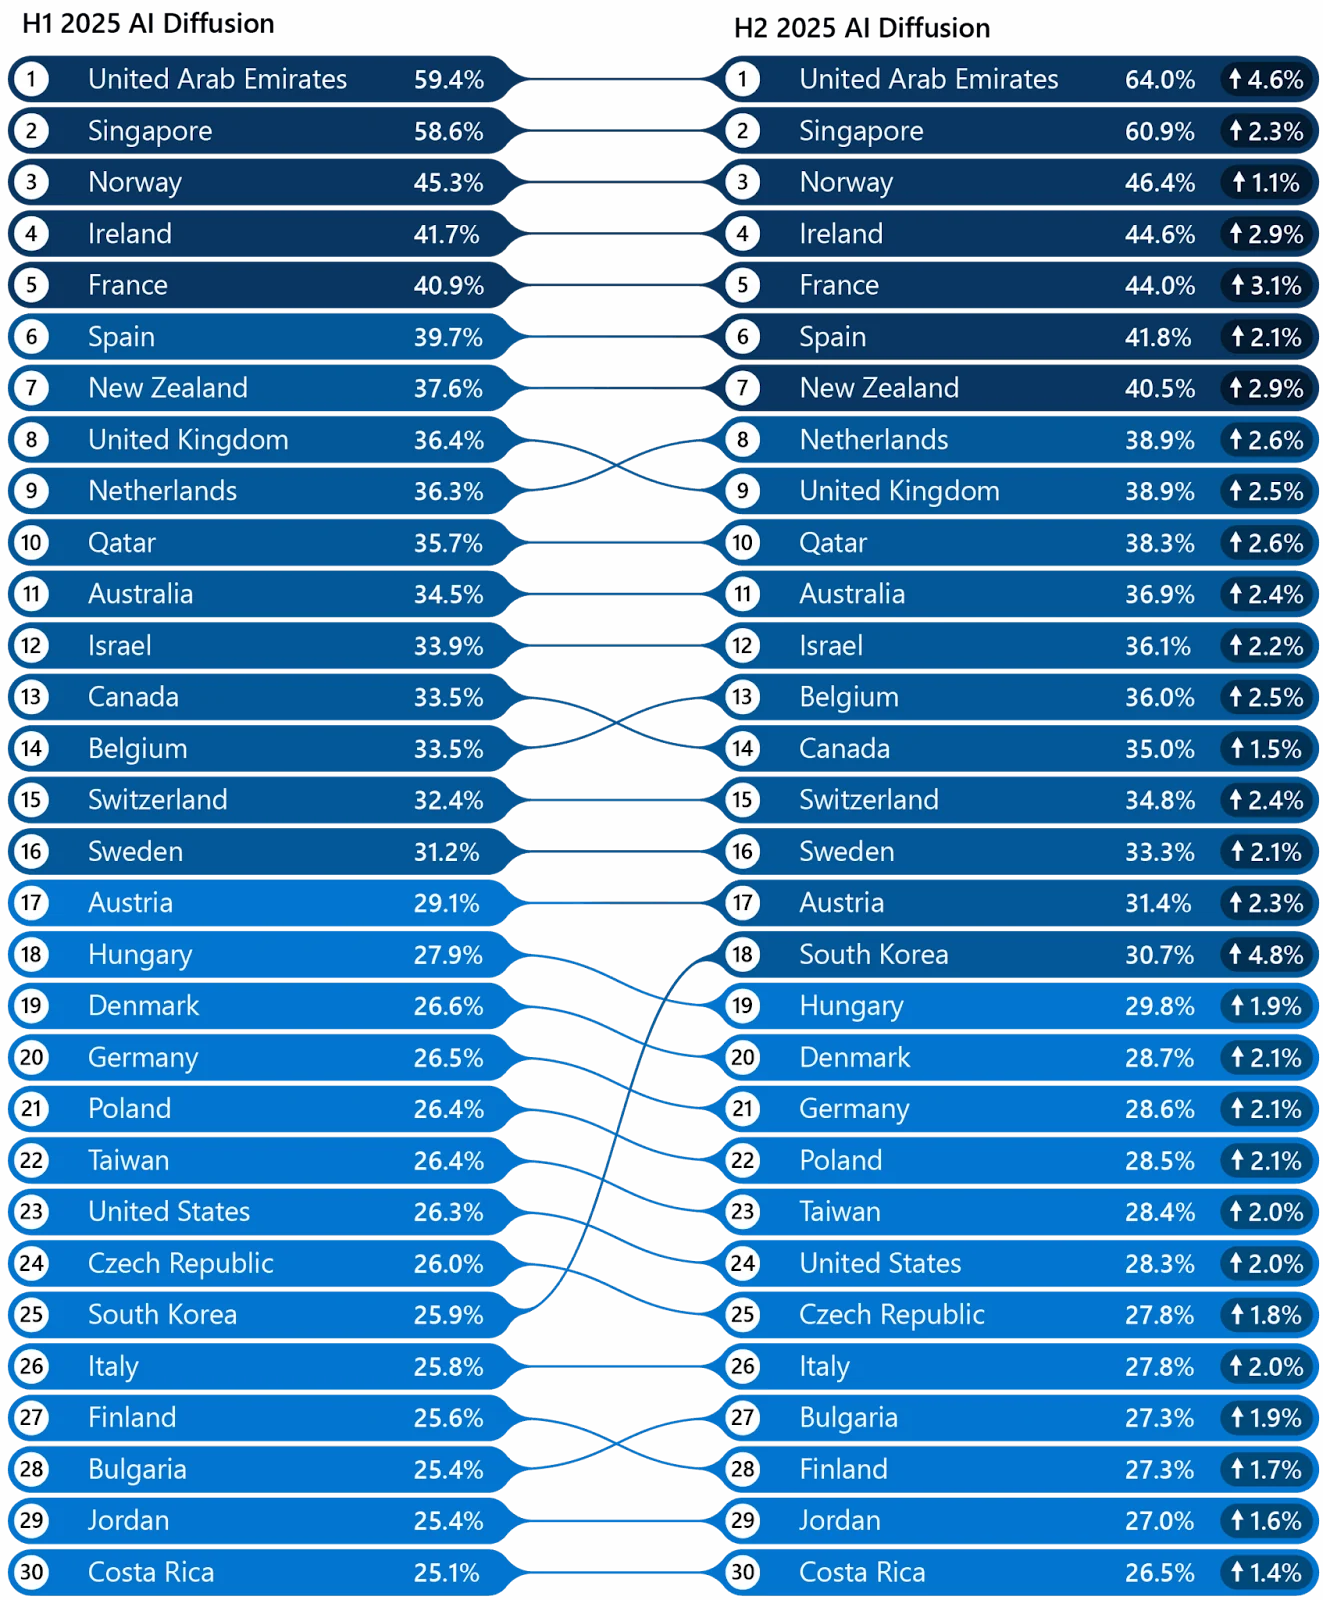
The report's original ranking compares the first and second halves of 2025. Its labels are already in English. The accessible table below transcribes all 30 countries, ordered by their second-half rank. Changes retain the percentage notation printed in the image.
Scroll across the table to read all columns.
| Country | H1 rank | H1 diffusion | H2 rank | H2 diffusion | Printed increase |
|---|---|---|---|---|---|
| United Arab Emirates | 1 | 59.4% | 1 | 64.0% | 4.6% |
| Singapore | 2 | 58.6% | 2 | 60.9% | 2.3% |
| Norway | 3 | 45.3% | 3 | 46.4% | 1.1% |
| Ireland | 4 | 41.7% | 4 | 44.6% | 2.9% |
| France | 5 | 40.9% | 5 | 44.0% | 3.1% |
| Spain | 6 | 39.7% | 6 | 41.8% | 2.1% |
| New Zealand | 7 | 37.6% | 7 | 40.5% | 2.9% |
| Netherlands | 9 | 36.3% | 8 | 38.9% | 2.6% |
| United Kingdom | 8 | 36.4% | 9 | 38.9% | 2.5% |
| Qatar | 10 | 35.7% | 10 | 38.3% | 2.6% |
| Australia | 11 | 34.5% | 11 | 36.9% | 2.4% |
| Israel | 12 | 33.9% | 12 | 36.1% | 2.2% |
| Belgium | 14 | 33.5% | 13 | 36.0% | 2.5% |
| Canada | 13 | 33.5% | 14 | 35.0% | 1.5% |
| Switzerland | 15 | 32.4% | 15 | 34.8% | 2.4% |
| Sweden | 16 | 31.2% | 16 | 33.3% | 2.1% |
| Austria | 17 | 29.1% | 17 | 31.4% | 2.3% |
| South Korea | 25 | 25.9% | 18 | 30.7% | 4.8% |
| Hungary | 18 | 27.9% | 19 | 29.8% | 1.9% |
| Denmark | 19 | 26.6% | 20 | 28.7% | 2.1% |
| Germany | 20 | 26.5% | 21 | 28.6% | 2.1% |
| Poland | 21 | 26.4% | 22 | 28.5% | 2.1% |
| Taiwan | 22 | 26.4% | 23 | 28.4% | 2.0% |
| United States | 23 | 26.3% | 24 | 28.3% | 2.0% |
| Czech Republic | 24 | 26.0% | 25 | 27.8% | 1.8% |
| Italy | 26 | 25.8% | 26 | 27.8% | 2.0% |
| Bulgaria | 28 | 25.4% | 27 | 27.3% | 1.9% |
| Finland | 27 | 25.6% | 28 | 27.3% | 1.7% |
| Jordan | 29 | 25.4% | 29 | 27.0% | 1.6% |
| Costa Rica | 30 | 25.1% | 30 | 26.5% | 1.4% |
A widening geopolitical divide: North and South
Behind the global average, however, lies a worrying divergence that deserves our full attention. The report confirms that adoption in the Global North is growing almost twice as fast as in the Global South. Advanced economies have already reached average penetration of 24.7% among their working population, while the South stands at 14.1%. Far from converging, the gap between the two blocs widened by almost a percentage point in just six months, from 9.8 to 10.6 points.
This supports the argument that, for now, AI multiplies existing capabilities rather than automatically equalising them. Where robust digital infrastructure and skilled human capital already exist, adoption accelerates exponentially through these complementarities; where those foundations are missing, growth is steady but slower. As the following chart illustrates, we risk entrenching a technological divide in which enormous productivity gains become geographically concentrated, leaving much of the world structurally in the slow lane.
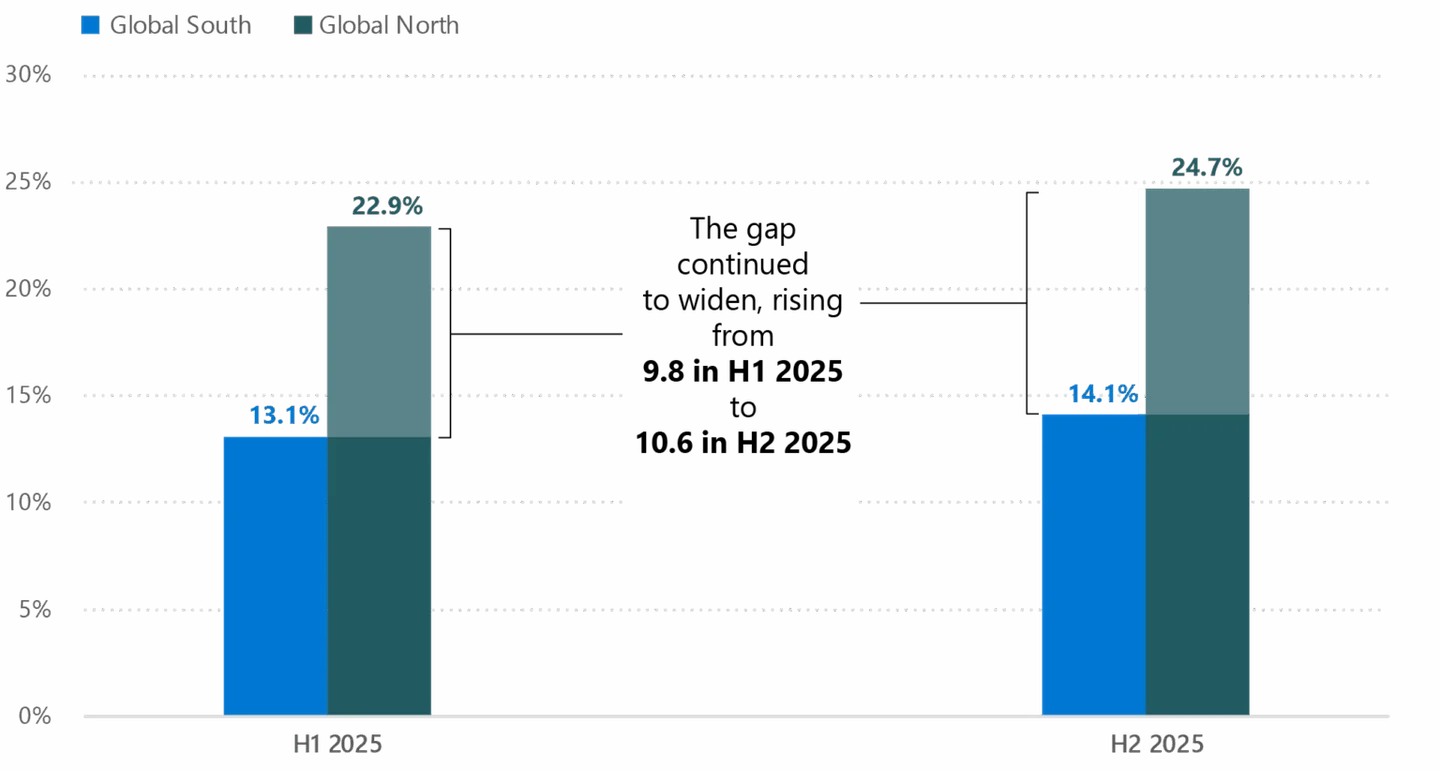
AI diffusion: the Global South rises from 13.1% in H1 2025 to 14.1% in H2; the Global North rises from 22.9% to 24.7%. The gap widens from 9.8 to 10.6 percentage points.
The good news: strategy matters more than technology
For many countries, the report's most encouraging finding is that success in adopting AI does not depend on having Silicon Valley within their borders.
Intuition might suggest that the United States, the undisputed leader in innovation and model development—R&D—should also lead adoption. The data show otherwise: it has fallen to 24th in per-capita use, at 28.3%.
Who leads instead? Countries that have invested in governance, infrastructure and trust. The United Arab Emirates, at 64%, and Singapore, at 60.9%, top the list, followed by a group of highly digitalised European nations. Spain stands out with a strong 41.8%, ahead of major economies such as the United Kingdom, Germany and Canada.
The optimistic lesson is clear: technological innovation is essential, but personal curiosity and institutional innovation are what bring use to scale. Small and medium-sized countries with clear national strategies, high digital literacy and trust in institutions are enabling their citizens to benefit from AI much faster than the superpowers creating the software.
Ibero-America: three different speeds
The figures for Ibero-American countries offer powerful indications of where talent and innovation are concentrating. The report depicts a region moving at three distinct speeds:
1. The adoption leaders. Spain consolidates its position as a global reference point, with 41.8% adoption, up more than two points in the last six months and ahead of G7 powers such as the United Kingdom and Germany. Alongside it, in Latin America, Costa Rica (26.5%) continues to post developed-country figures. But the big surprise is the Dominican Republic (22.7%), third in the regional ranking, ahead of much larger economies and showing enviable digital dynamism in the Caribbean.
2. Emerging hubs and Argentina's awakening. A solid group has passed the psychological 20% threshold, a sign that AI has permeated productive activity. It includes Uruguay (22.5%) and Colombia (22.0%), closely followed by Panama (21.5%) and Chile (20.8%). Argentina deserves special mention. Despite its macroeconomic circumstances, it has recorded one of the region's biggest jumps, +1.8%, from 17.8% to 19.6%. This confirms that individual talent in Argentina is adopting productivity tools faster than its neighbours, already overtaking Mexico and Brazil.
3. The challenge facing the giants, and the access gap. The strategic concern is Mexico (17.8%). It is growing, but more slowly, at +1.1%, than its regional competitors. For Latin America's second-largest economy, remaining below the regional average is a warning for future competitiveness. At the bottom of the table, Venezuela (9.0%) and Cuba (6.1%) show where the digital divide is sharpest. These markets, where affordability creates barriers to access, are precisely where the “open-source diplomacy” of free Chinese models such as DeepSeek could expand most strongly in 2026.
While preparing this article, I read this interesting piece by Pep Martorell on the state of AI in Latin America. It examines the 2025 Latin American Artificial Intelligence Index, or ILIA, promoted by ECLAC and led by Chile's National Centre for AI. It is highly recommended and entirely complementary reading. Although many Latin American countries have impressive adoption rates, often above the global average, the region is in a deeply worrying position on other key measures, such as AI investment.
With GPT-5.2's help, I generated the following table containing only Spanish-speaking countries, making them easier to find than in the four-page general table in the report.
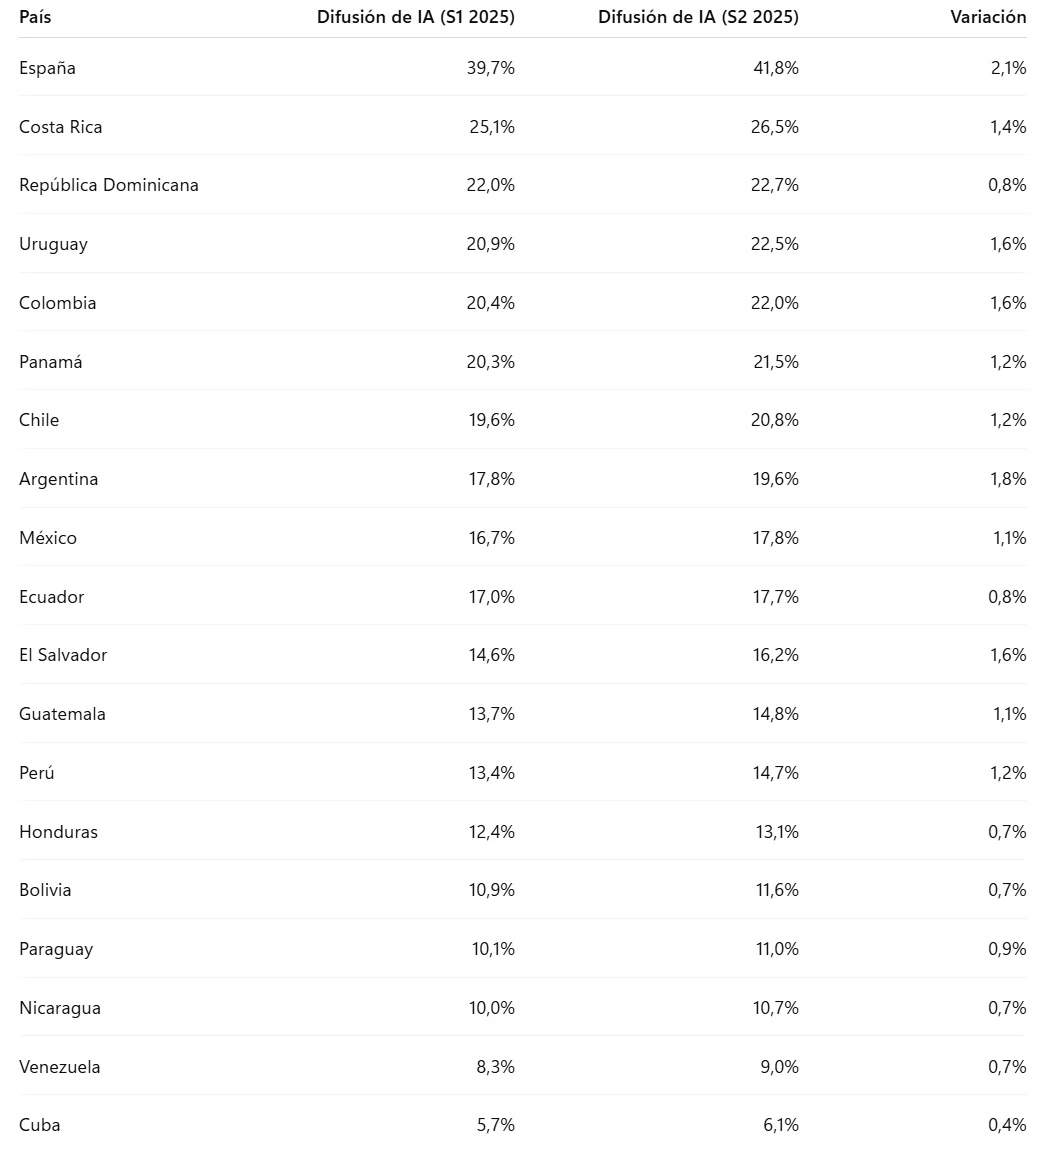
English transcription of the original table. “Change” reproduces the printed figures, including differences that do not exactly match subtraction of the rounded endpoints; these have not been silently corrected.
Scroll across the table to read all columns.
| Country | AI diffusion, H1 2025 | AI diffusion, H2 2025 | Printed change |
|---|---|---|---|
| Spain | 39.7% | 41.8% | 2.1% |
| Costa Rica | 25.1% | 26.5% | 1.4% |
| Dominican Republic | 22.0% | 22.7% | 0.8% |
| Uruguay | 20.9% | 22.5% | 1.6% |
| Colombia | 20.4% | 22.0% | 1.6% |
| Panama | 20.3% | 21.5% | 1.2% |
| Chile | 19.6% | 20.8% | 1.2% |
| Argentina | 17.8% | 19.6% | 1.8% |
| Mexico | 16.7% | 17.8% | 1.1% |
| Ecuador | 17.0% | 17.7% | 0.8% |
| El Salvador | 14.6% | 16.2% | 1.6% |
| Guatemala | 13.7% | 14.8% | 1.1% |
| Peru | 13.4% | 14.7% | 1.2% |
| Honduras | 12.4% | 13.1% | 0.7% |
| Bolivia | 10.9% | 11.6% | 0.7% |
| Paraguay | 10.1% | 11.0% | 0.9% |
| Nicaragua | 10.0% | 10.7% | 0.7% |
| Venezuela | 8.3% | 9.0% | 0.7% |
| Cuba | 5.7% | 6.1% | 0.4% |
The “Korean miracle” as a model
For an example of how change can be accelerated, look at South Korea. In just six months, it jumped from 25th to 18th, becoming the success story of the half-year.
Its recipe is not magic; it can be replicated:
- Public policy: an AI Basic Act and a national committee provided certainty.
- Culture and language: adoption surged when models such as GPT-4o became dramatically more fluent in Korean and culturally relevant uses—exam preparation and entertainment—went viral.
This shows that when technology “speaks our language”, both literally and culturally, and government lays the right foundations, society responds more readily.
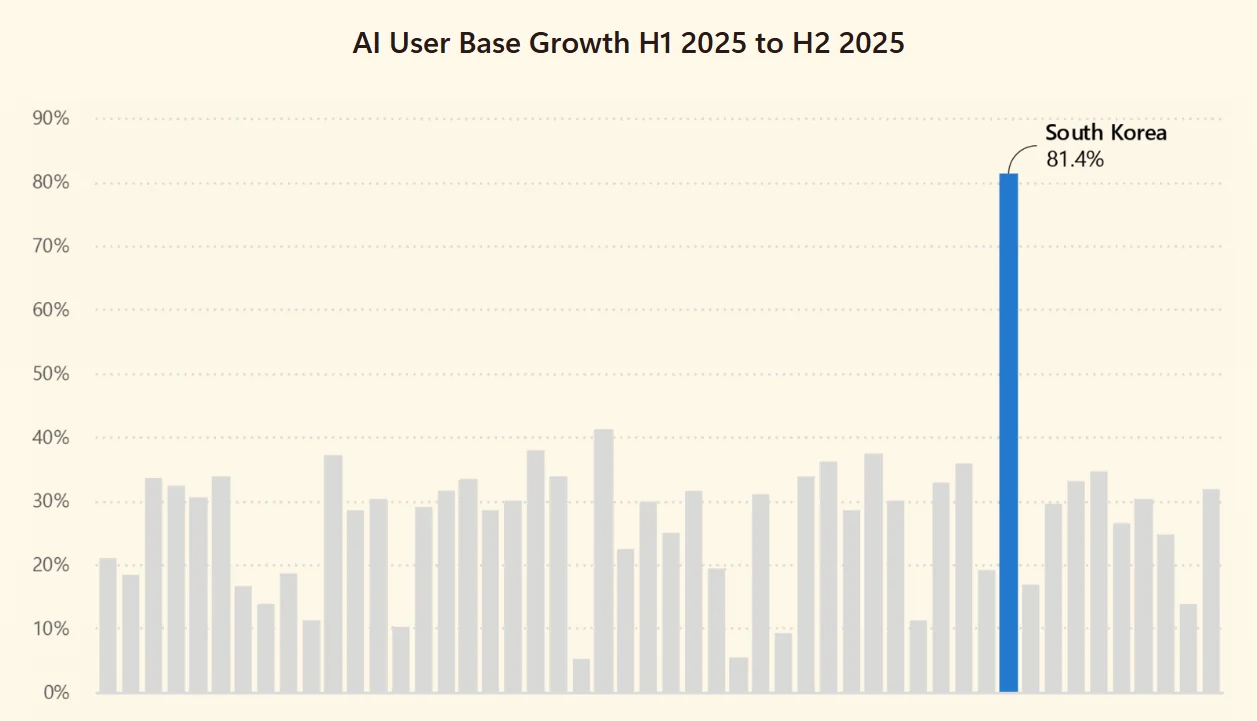
The original chart is titled “AI User Base Growth H1 2025 to H2 2025” and highlights South Korea at 81.4%. Other bars have no country labels in the preserved image. This user-base growth measure is distinct from the adoption percentages in the ranking above.
Conclusion: the ball is in policymakers' court
The report confirms that AI behaves as a technology of complementarities. To flourish, it needs human capital, digital infrastructure and trust alongside it.
Spain's excellent position—sixth in the world—and the green shoots in Latin America give us grounds for optimism about adoption. On other, equally essential fronts, including investment, innovation and computing capacity, we remain worryingly far behind in different ways. Perhaps these data suggest that we are not condemned to be passive spectators of imported technology. We can lead in the most important final layer: practical application and actual use.
The challenge for the public sector is no longer to ask whether AI will arrive: the data confirm that it is already here and growing rapidly worldwide. The strategic question now is this: how will we turn that 41% usage rate in Spain, or 26% in Costa Rica, into tangible gains in productivity and public services?
Director of Digital Innovation at ALEPH Educational Institution and editor of estrategIA.
Cite this essay
Fernando Nieto Lobato. “AI has crossed the 15% chasm, and the digital divide is widening: Microsoft's global report on AI diffusion in 2025.” estrategIA, issue 121, 21 January 2026. English edition, 29 September 2026. https://elcontemplador.github.io/estrategia-english/essays/121/