Archive context: this anniversary article was published on 1 October 2025. Its comparisons, prices and forecasts retain that historical perspective. Accessible descriptions below distinguish printed chart values from approximate readings of plotted points.
This week marks two years since this newsletter began. In the recent hundredth issue, which we recommend reading, we developed a theoretical message we consider vitally important—AI keeps accelerating while politics falls behind—from a more narrative and “qualitative” perspective. In this issue, we will focus on gaining perspective on the change in artificial intelligence over these two years, from October 2023 to today. To do so, we simply draw on five charts showing the enormous leap within a process that, despite some setbacks, continues to accelerate.
1. Users
Over these two years, AI has gone from a technology that was still rather niche to something fairly commonplace. It is no longer at all unusual to walk down the street or sit in a café and hear conversations mentioning ChatGPT. Finding reliable, universally agreed data on this has been difficult. We therefore invite you to treat all the figures in this article with some caution, despite our efforts to find the best sources and cross-check them in several ways. We have seen several sources putting the total number of users at over a billion already, which seems quite plausible in light of the figures for the two AIs with the most users and their absolutely astonishing growth.
Using figures directly from the companies themselves—because some recent external estimates are higher—ChatGPT has grown from around 100 million users at the end of 2023 to more than 700 million, and weekly active users at that, over these two years. Meanwhile, Gemini, Google's AI, which did not yet exist a couple of years ago, had already passed 450 million users this past summer.
AI has quickly ceased to be a minority pursuit reserved for technical specialists and early adopters, becoming one of the fastest-growing technologies in history.
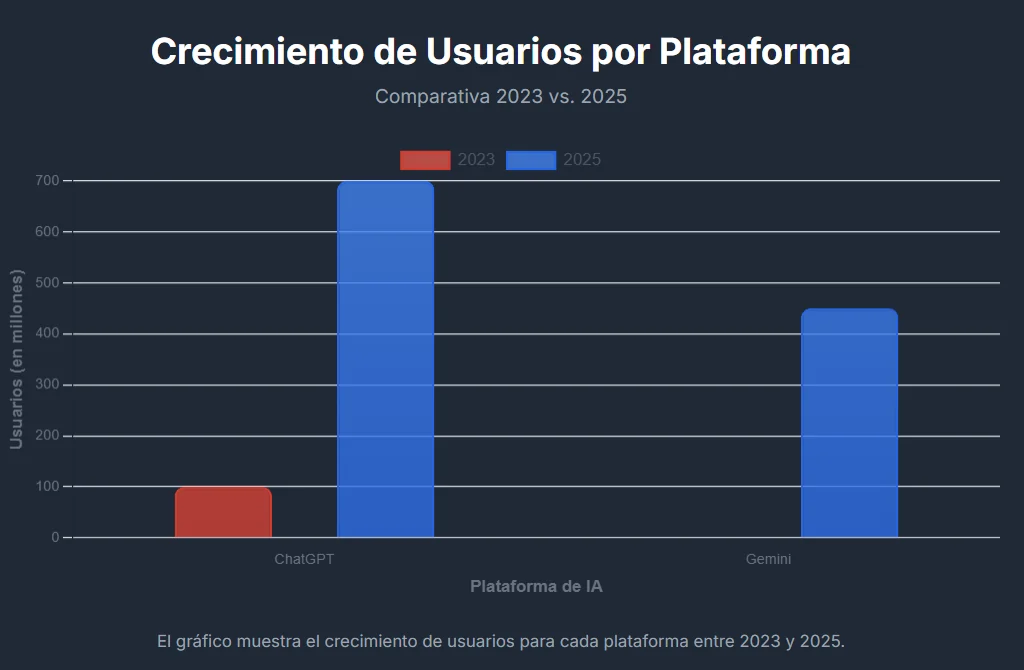
Chart labels, translated: “User growth by platform”; “2023 versus 2025 comparison”; vertical axis “Users (millions)”, from 0 to 700; horizontal axis “AI platform”. Legend: 2023 in red and 2025 in blue. The bars show approximately 100 million ChatGPT users in 2023 and 700 million in 2025, and 450 million Gemini users in 2025; there is no visible 2023 Gemini bar. Footer: “The chart shows user growth for each platform between 2023 and 2025.” The chart does not specify an activity period for its user counts.
2. AI performance and capabilities
AI's growing popularity has come largely alongside improvements in model capabilities, to the point that the great majority of the tests and rankings—benchmarks—used to measure those capabilities are now completely saturated: new models already perform almost perfectly on them. Much harder benchmarks have therefore been created, but we are seeing AI begin to saturate those too, at tremendous speed.
There are also sets of evaluations designed to measure this process in combination, such as the one linked here, where you can see that GPT-5 scores almost three times as highly as GPT-4 Turbo, the star model released in November 2023.
We find one chart especially interesting, and its very nature makes it difficult to saturate for now: the one measuring how long a human would take to complete the tasks a model can perform correctly. That duration usually corresponds, logically, to greater complexity. This interesting benchmark shows very clearly the enormous leap in capability from 2023 to today. GPT-4 correctly completed tasks lasting up to nine minutes, at least 50% of the time; GPT-5 has already reached two hours and 17 minutes. The chart also shows that AI capabilities are still growing exponentially. If this continues, we can expect eight hours to be reached by the middle of next year, and models to execute very complex tasks that would take a human weeks or even months of work within a very few years.
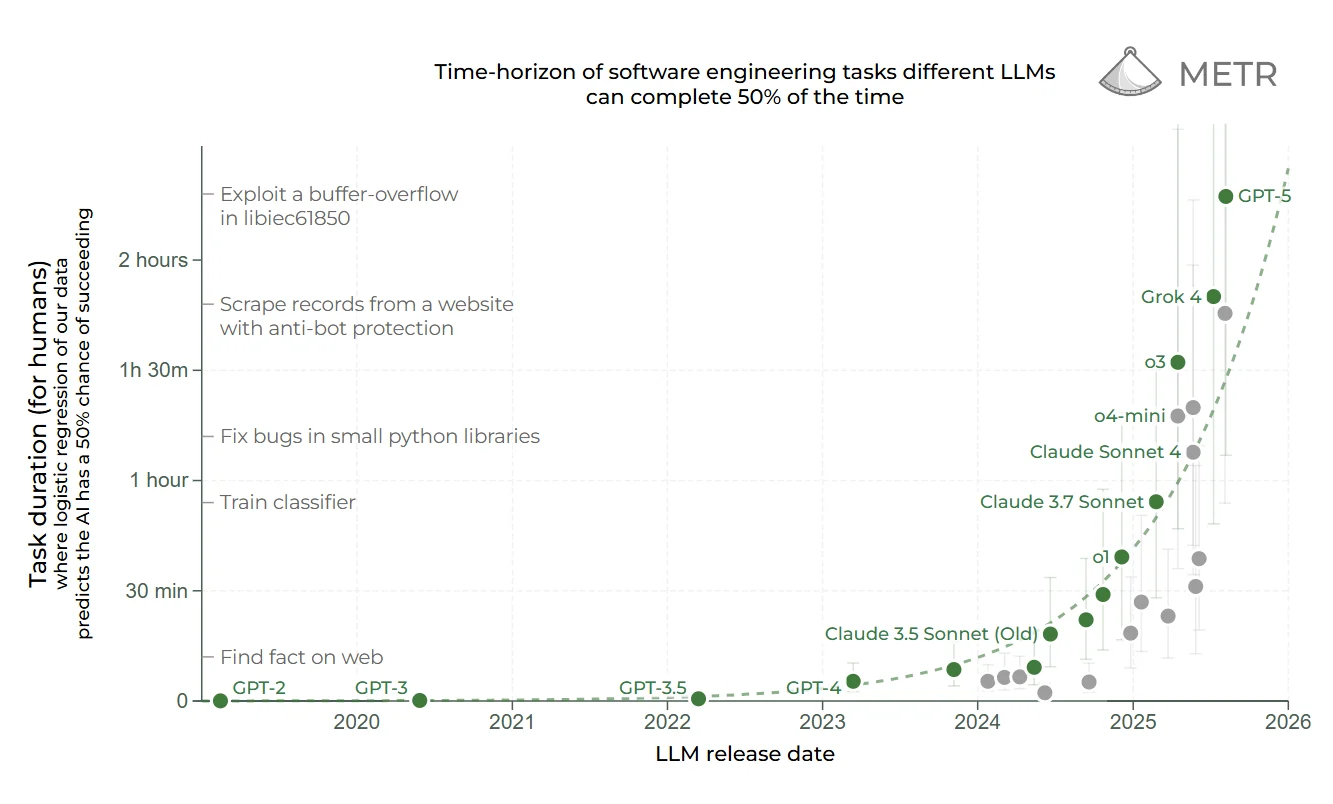
Chart transcription: “Time-horizon of software engineering tasks different LLMs can complete 50% of the time”. Horizontal axis: “LLM release date”, with years 2020–2026. Vertical axis: “Task duration (for humans) where logistic regression on our data predicts the AI has a 50% chance of succeeding”, with marks at 0, 30 minutes, 1 hour, 1 hour 30 minutes and 2 hours. Labelled models: GPT-2, GPT-3, GPT-3.5, GPT-4, Claude 3.5 Sonnet (Old), o1, Claude 3.7 Sonnet, o4-mini, Claude Sonnet 4, o3, Grok 4 and GPT-5. Illustrative task labels, from shorter to longer: “Find fact on web”; “Train classifier”; “Fix bugs in small python libraries”; “Scrape records from a website with anti-bot protection”; “Exploit a buffer-overflow in libiec61850”. Points, uncertainty bars and a rising dashed curve are retained in the image; exact values for the two highlighted models follow.
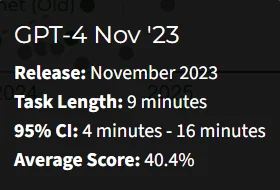
Scroll across the table to read all columns.
| GPT-4 Nov'23 tooltip | Displayed value |
|---|---|
| Release | November 2023 |
| Task length | 9 minutes |
| 95% confidence interval | 4–16 minutes |
| Average score | 40.4% |
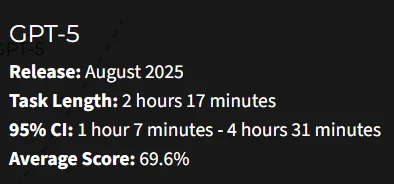
Scroll across the table to read all columns.
| GPT-5 tooltip | Displayed value |
|---|---|
| Release | August 2025 |
| Task length | 2 hours 17 minutes |
| 95% confidence interval | 1 hour 7 minutes–4 hours 31 minutes |
| Average score | 69.6% |
3. Cost and performance
So far, then, we can clearly see that user numbers have multiplied substantially since 2023 and that models are much more capable. But another fundamental factor in making AI practically ubiquitous is that, as models improved—or even faster—their costs plummeted.
This chart by Wharton professor and leading AI expert Ethan Mollick, author of Co-Intelligence, makes the point very clear. While GPT-4, the leading model for most of 2023, cost around $30 per million tokens, models several times more capable, such as GPT-5 Nano, now cost barely a few cents. Even the very recently released Grok 4 Fast, which is almost on a par with GPT-5 and above the level of an average human PhD, costs only a few cents per million tokens.
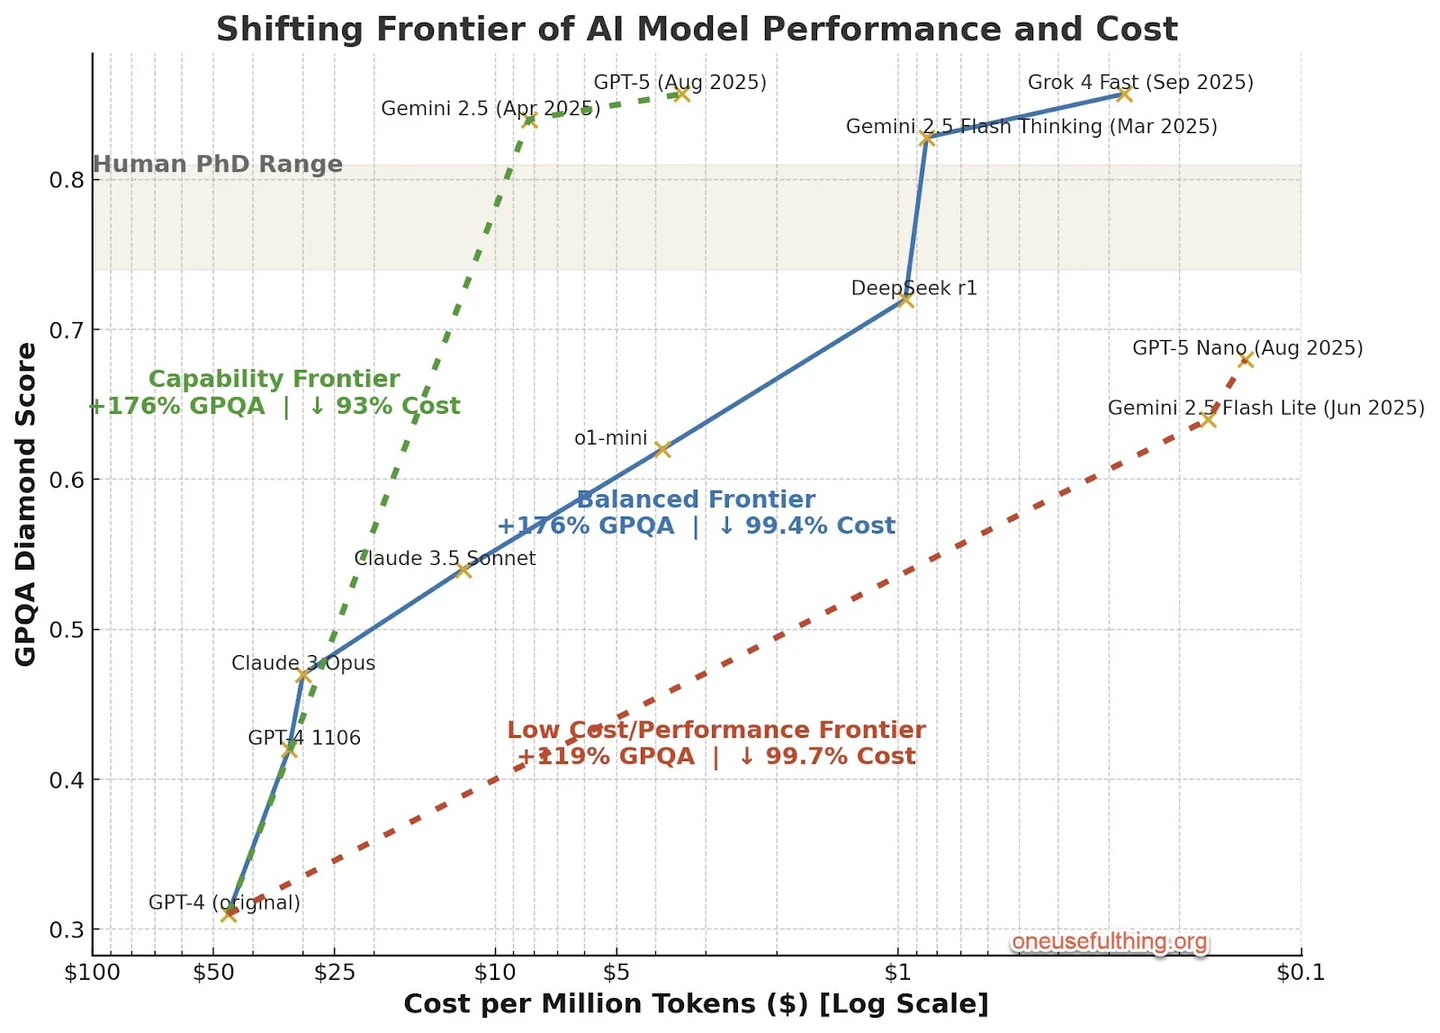
Chart transcription: “Shifting Frontier of AI Model Performance and Cost”. Vertical axis: “GPQA Diamond Score”; horizontal axis: “Cost per Million Tokens ($) [Log Scale]”, decreasing left to right from $100 to $0.1. The shaded “Human PhD Range” spans approximately 0.74–0.81. Annotations: “Capability Frontier: +176% GPQA | ↓ 93% Cost”; “Balanced Frontier: +176% GPQA | ↓ 99.4% Cost”; “Low Cost/Performance Frontier: +119% GPQA | ↓ 99.7% Cost”. Credit: oneusefulthing.org.
The table gives approximate visual readings, not exact underlying data. The original chart plots GPT-4 (original) around $45, while the article's prose above cites around $30; both are preserved.
Scroll across the table to read all columns.
| Labelled model | Approximate cost per million tokens | Approximate GPQA Diamond score |
|---|---|---|
| GPT-4 (original) | $45 | 0.31 |
| GPT-4 1106 | $33 | 0.42 |
| Claude 3 Opus | $30 | 0.47 |
| Claude 3.5 Sonnet | $12 | 0.54 |
| o1-mini | $3.8 | 0.62 |
| DeepSeek r1 | $0.95 | 0.72 |
| Gemini 2.5 Flash Thinking (March 2025) | $0.85 | 0.83 |
| Grok 4 Fast (September 2025) | $0.28 | 0.86 |
| Gemini 2.5 (April 2025) | $8.3 | 0.84 |
| GPT-5 (August 2025) | $3.4 | 0.86 |
| Gemini 2.5 Flash Lite (June 2025) | $0.17 | 0.64 |
| GPT-5 Nano (August 2025) | $0.14 | 0.68 |
The key is that the trend continues: every passing month brings better, cheaper models. Some experts and company leaders, such as Sam Altman, predict that this trend will continue until intelligence becomes so cheap that we scarcely measure its cost, and that cost is practically equivalent to the electricity needed to generate it.
4. Investment
Clearly, given the prospect of ever-better, cheaper models reaching more and more users, investment in AI is enormous. There may very well be some degree of a bubble. But, as happened with the dot-com bubble at the turn of the century, the technology companies that emerged—or re-emerged—in that context are now the world's leading companies. That is why there is an enormous race, in which several states are also participating to some extent, to be competitive in a field that clearly has the potential to transform the economy and life on this planet in a distinctive way.
According to the latest CB Insights report, AI funding in the first half of 2025—$116.1 billion—already exceeded the total for 2024, $105.7 billion. This was driven by megadeals such as OpenAI's $40 billion funding round and significant investment in infrastructure, defence technology and humanoid robots.
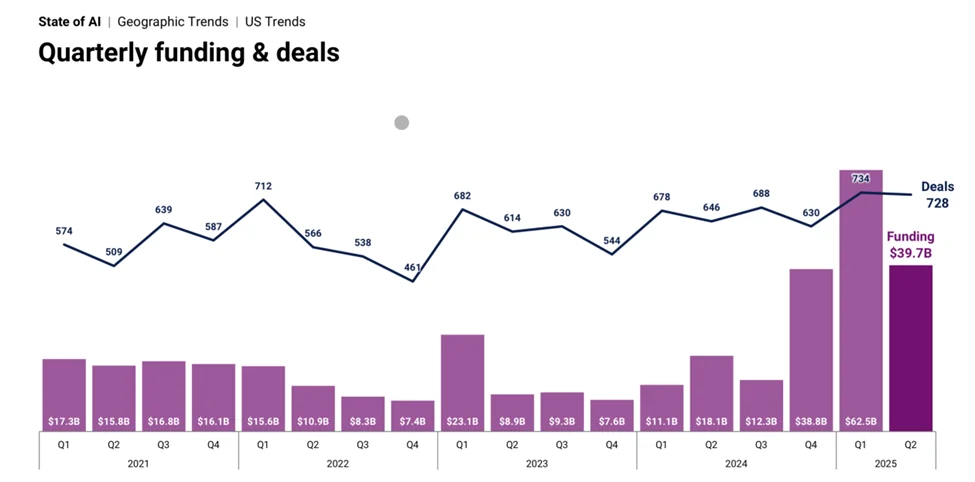
The screenshot is explicitly labelled “State of AI | Geographic Trends | US Trends” and “Quarterly funding & deals”. It therefore shows the US series, whereas the preceding paragraph gives the report's broader funding totals. Values printed in the image:
Scroll across the table to read all columns.
| Quarter | Funding, US$ billions | Deals |
|---|---|---|
| 2021 Q1 | 17.3 | 574 |
| 2021 Q2 | 15.8 | 509 |
| 2021 Q3 | 16.8 | 639 |
| 2021 Q4 | 16.1 | 587 |
| 2022 Q1 | 15.6 | 712 |
| 2022 Q2 | 10.9 | 566 |
| 2022 Q3 | 8.3 | 538 |
| 2022 Q4 | 7.4 | 461 |
| 2023 Q1 | 23.1 | 682 |
| 2023 Q2 | 8.9 | 614 |
| 2023 Q3 | 9.3 | 630 |
| 2023 Q4 | 7.6 | 544 |
| 2024 Q1 | 11.1 | 678 |
| 2024 Q2 | 18.1 | 646 |
| 2024 Q3 | 12.3 | 688 |
| 2024 Q4 | 38.8 | 630 |
| 2025 Q1 | 62.5 | 734 |
| 2025 Q2 | 39.7 | 728 |
5. Public perceptions
Against these decisive increases in users, investment and model capabilities, and falling prices, what we have found particularly curious is that public perceptions of AI—undoubtedly a very complex thing to measure—seem to remain stable, at least in this important annual Pew Research study, with barely any change from 2023.
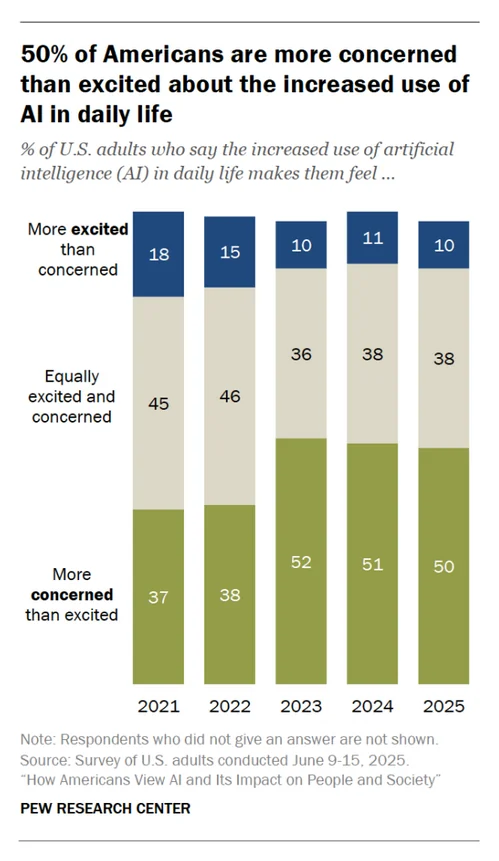
Chart transcription: “50% of Americans are more concerned than excited about the increased use of AI in daily life”. Figures are percentages of US adults who say the increased use of AI in daily life makes them feel as follows:
Scroll across the table to read all columns.
| Year | More excited than concerned | Equally excited and concerned | More concerned than excited |
|---|---|---|---|
| 2021 | 18 | 45 | 37 |
| 2022 | 15 | 46 | 38 |
| 2023 | 10 | 36 | 52 |
| 2024 | 11 | 38 | 51 |
| 2025 | 10 | 38 | 50 |
Original note: respondents who did not give an answer are not shown. Source: survey of US adults conducted 9–15 June 2025; “How Americans View AI and Its Impact on People and Society”, Pew Research Center.
Very probably, a real understanding of the scale of the transformation ahead, which we can see in charts like these—or in this cartoon's rather amusing portrayal—is still far removed from the ordinary person's thinking. They may be beginning to use ChatGPT or Gemini, or even encountering Google's new AI answers directly without changing their behaviour at all. But they lack sufficient perspective or even a minimally deep understanding of this phenomenon. If, as seems likely, exponential growth in capabilities, falling costs and mass adoption continue, it will lead us within a few years to live in a world that is, in several respects, very different from today's.
Ultimately, these five charts map a revolution that is accelerating rapidly. In just two years, artificial intelligence has moved from niche use to mass adoption, multiplying its capabilities exponentially—only yesterday OpenAI launched Sora 2, and comparisons with 2024's Sora 1 provide another good illustration—while its costs collapsed. This perfect storm of innovation and accessibility has unleashed unprecedented investment, confirming that we are facing an economic and social paradigm shift. Yet the stability of public perceptions reveals a dangerous gap: while technology advances exponentially, collective understanding and the political response remain linear. That mismatch defines the greatest strategic challenge of our time.
Director of Digital Innovation at Institución Educativa ALEPH and director of estrategIA
Cite this essay
Fernando Nieto Lobato. “Five charts to understand two years of AI: adoption, capabilities, costs, investment and public perceptions.” estrategIA, issue 105, 1 October 2025. English edition, 29 September 2026. https://elcontemplador.github.io/estrategia-english/essays/105/